Imaging camera parameters and description
Introduction
A detailed description of the imager can be found in Gunn et al. (1998) and in
the project
book. This page summarizes the most important information needed to
understand the data it produces:
| Photometric CCDs |
30 2048 × 2048 SITe/Tektronix 49.2 mm square CCDs, arranged in 6
columns parallel to the scan direction and 5 rows perpendicular to
the scan direction |
| CCD read noise |
< 5e- pixel-1 (overall system is sky
limited) |
| Image frame size |
2048 × 1361 pixels (13.51 × 8.98 arcminutes) |
| Image column separation |
25.17 arcminutes |
| Detector separation along column |
17.98 arcminutes |
| Focal-plane image scale |
3.616 mm arcmin-1 |
| Detector image scale |
3.636 mm arcmin-1 |
| Pixel size and scale |
24 μm; 0.396 arcseconds pixel-1 |
| Filters |
r i u z g scanned in that order, 71.7 seconds apart |
| Integration time |
54 s |
| Operating mode |
drift scan |
| Field distortion |
<0.1 arcseconds over the entire field |
| Field size |
2°.5 |
| Flux calibration |
Standard-star fields at 15° intervals along scans,
tied to BD + 17° 4708, atmospheric extinction
determined by the PT |
| Astrometric CCDs |
22, 0.25 × 2 inches, above and below CCD columns; r filter plus 3
mag neutral density filter, 10.5 second integration time |
The photometric flux calibration
web page is essential reading for those wishing to understand the SDSS
photometric system.
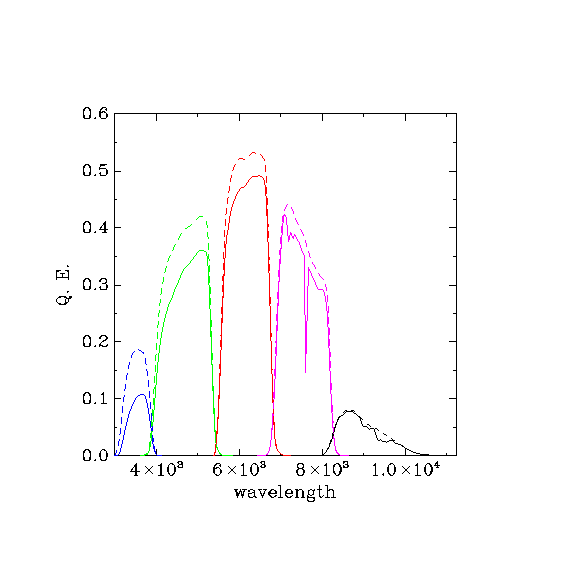
SDSS system response plot
The solid response curves show the througput defining the survey's
photometric system, which includes extinction through an airmass of
1.3 at Apache Point Observatory. For reference, the dashed curves do
not include any atmospheric extinction. These are sometimes loosely
referred to as "filter curves" although they do include the
full system response from atmosphere to detector.
Tables
Tables of camera sensitivity through each filter are available as html tables and as ASCII tables: u.dat g.dat r.dat i.dat z.dat
The columns of the table represent:
- wavelength
- on the sky sensitivity looking through 1.3 airmasses at APO for a point
source. These define the survey's photometric system.
- sensitivity under these conditions for very large sources (size greater
than about 80 pixels) for which the infrared scattering is
negligible (the infrared scattering only affects the thinned
detectors used for ugri and among these, it is
negligible for ug; hence this column is different from
column 1 only for ri)
- the response of the third column with no atmosphere
- assumed atmospheric transparency at one airmass at Apache Point
Observatory
|