Spectra
Up: Data Products Sections: Images - Object lists - Spectra - Tiling
Down: Quality of spectra - About SDSS spectra - Caveats
DR6 contains completely reprocessed spectra
In DR6, there have been substantial improvements to the algorithms
which photometrically calibrate the spectra, and all spectra have been
re-reduced. The new spectro "rerun number" is 25.
About spectroscopic samples
Normal survey plates
The spectroscopic survey is predominantly a survey for
There is also a large number of spectra of stars. Brown dwarfs, ROSAT and
FIRST counterparts are targetted as well. Refer to the target selection quality or target selection algorithm for
details about the spectroscopic survey targets.
Extra and special plates, including SEGUE
New since DR4 is the publication of "extra" and
"special" plates. Extra plates are repeat
observations of normal survey plates. These have the same plate number
as the original observation, but a different MJD and usually a
different mapping between fiber number and
ra,dec. Special plates are spectroscopic
observations made under a variety of special programs which are
described on the special spectra
page.
Note the caveat below about querying
special-plate data in the CAS (including SEGUE).
Getting and using spectra
The spectra distributed by the SDSS have been sky subtracted,
corrected for telluric absorption spectrophotometrically
calibrated by the Spectro2d pipeline. Spectral classification,
redshift determination, and emission and absorption line measurements
are carried out by the "1D" pipeline. DR6 for the first time
contains the outputs from two independent 1D pipelines: the
spectro1d code that has also been used in all previous
releases, and the specBS
code whose outputs ("Princeton reductions") were previously
available only from spectro.princeton.edu. The CAS
contains only the spectro1d outputs as before; the
specBS outpus are available through the DAS.
The algorithms page
contains details about spectroscopic data processing for all pipelines.
Since DR1, the Data Archive Server has been providing the same spectrum in two
files:
- Spectro2d
spPlate*.fits:
all calibrated spectra and supporting data (signal-to-noise,
resolution, quality flags and similar) from a single plate,
without any parameters or continuum fits. New in
DR6: the spPlate files now also contain the sky spectra
that have been used for sky subtraction of each spectrum.
See the spPlate*.fits
data model for details of the file contents. There is one 2d
directory for every plate number in the DAS that contains all
spPlate files for that plate, including those for
different MJDs where repeats are available; e.g. http://das.sdss.org/DR6/data/spectro/2d_25/0644/
- Spectro1d
spSpec*.fits:
multiple fits extensions (images and tables) with the calibrated
spectrum, a continuum-subtracted spectrum, and all measured parameters
(redshift, line fits, line indices, per-pixel resolution). See
the spSpec*.fits
data model for details of the file contents, and how to read an spSpec file. There
is one spSpec file per plate/MJD/fiber combination, found in a
parallel 1ddirectory tree with one directory
per plate, e.g. http://das.sdss.org/DR6/data/spectro/1d_25/0644/1d/
- In addition, spectro1d produces
spPlot*.gif,.ps
plots of the spectra with line locations for the best-fitting
redshift, again in one directory per plate, e.g. http://das.sdss.org/DR6/data/spectro/1d_25/0644/gif/
All of the above files are available through the DAS query form.
DR6 provides additional spectroscopic data:
- spectro2d
spCFrame*.fits:
SDSS spectra are typically combined from 3 or more individual
exposures of 15 minutes each. The individual flux-calibrated
spectrograph exposures are available in spCFrame*.fits
files. They contain spectra in the spectrograph's native
wavelength mapping, which is neither linear in wavelength nor
log-wavelength.
specBS
outputs ("Princeton reductions"; see https://web.archive.org/web/20161021194947/https://web.archive.org/web/20161021194947/http://spectro.princeton.edu/):
There is one file of each type for every plate/MJD
combination.sspp stellar parameter pipeline outputs: Most of
these outputs are available only through two new tables in the CAS:
- Line index equivalent widths for stars:
sppLines
- Stellar atmospheric parameters ([Fe/H], log g, Teff) for stars:
sppParams
for all the SEGUE
spectra and a large fraction of the main
database spectra classified as stars (not galaxies or quasars).
In the DAS, we provide bulk versions of the stellar parameter
outputs in one directory per plate/MJD combination, e.g. DR6/data/spectro/sspp_25/0644-52149,
which include .csv versions of the sppParams and sppLines
tables and some additional information and plots not available through the
CAS.
The specBS outputs are available through the DAS query form. The
spCFrame files are not available through the DAS query
form, but can be found in the same 2d directories as the
spPlate files in the DAS; these also contain the specBS
outputs. E.g., http://das.sdss.org/DR6/data/spectro/2d_25/0644/.
More on data access
The data access page contains various
query forms to get spectra by coordinates, or to search for spectra by
redshift, object magnitude, color etc., and to retrieve them from the
archive. In particular, the Catalog Archive Server provides
a fast search capability for object lists and spectroscopic parameters
as well as pointers to the files in the Data Archive Server, whose
structure is explained on the Data
Archive Server structure and contents page. The Spectro Query
Server query form is dedicated to the search of the spectroscopic
database. You can also download fits tables with the classification,
redshifts and other information from the page with redshift catalogs and
spectro+imaging data.
Please note the caveats below, which are
essential to obtain meaningful scientific results from analysing SDSS
spectra, in particular the redshift status
caveat.
Imaging information associated with each spectrum
Very often one wishes to obtain all the SDSS photometric (imaging
camera) data associated with each spectrum. One can obtain this
information most easily for nearly all plates through the SQS
interface by selecting imaging parameters to return with your selected
spectra.
For those who prefer working with the full fits files of spectra
and imaging catalogs, make available a special set of files
(spObj-*.fit) containing a bundled version of the
spectroscopic data and all the corresponding imaging data.
These files are available via the DAS by requesting the
data product tsObjFromMap (or spObj) for the plates you
wish. To get these files in bulk for the entire survey, see the page on getting redshift catalogs and SDSS spectra
and corresponding imaging data.
Quality of spectra
About the spectra
For details about the spectrographs, see the spectrograph
page.
| Plate diameter | 3 degrees |
| Fiber diameter | 3 arcsec |
| Wavelength coverage | 3800 - 9200 Å |
| Wavelength calibration | better than 5 km/s |
| Wavelength reference | heliocentric vacuum wavelengths |
| Binning | log-lambda, 69 km/s per pixel |
| Resolution | 1850 to 2200; value for each spectrum in spPlate*.fits |
| Flux Units | 10-17 erg/s/cm2/Å |
Further details
- Error and mask arrays, and (new in DR6) the sky spectrum
subtracted from each object spectrum, are available (see the data model.)
- Spectroscopic observations are undertaken in non-photometric conditions
when the imaging camera is not in use. At least three
fifteen-minute exposures are taken until the cumulative mean S/N
per pixel exceeds 4 for a fiducial fiber magnitude of
g = 20.2 and i = 19.9.
- We provide the cross-correlation
templates used to obtain cross-correlation
redshifts.
Caveats
Bug in synthetic magnitude tabulation in DR6 CAS
There is a bug in the tabulating of synthetic magnitudes of objects
based on their integrated, flux calibrated spectra convolved with
the SDSS filter curves. In the CAS table specObjAll (and its subset
table specObj), the three quantities: mag_0, mag_1, and mag_2
are intended to be the synthetic g, r, and i band magnitudes
of each object. In fact, in DR6 they are the
u, g, and r band synthetic magnitudes. The wavelength
coverage of the u band (centered on 3551 Angstroms) does
not overlap (except at the few percent level) the wavelength coverage
of the spectrographs (which start at about 3800 Angstroms), and
the synthetic u band is only a very rough estimate. Thus, the
i synthetic magnitude is not directly available in the DR6
CAS database.
If you currently need access to the i band synthetic magnitude,
they are currently only available in the DR6 DAS:
You may find them in HDU# 7 of the spPlate-$plate-$mjd.fits
file in the form of a 640x5 (row x col) size image extension
table containing the u,g,r,i,z synthetic magnitudes for
all 640 objects with spectra, in fiber number order
(i.e. the first 5 numbers are for the ugriz synthetic mags
for the object at fiber#1, etc).
You may download the full spPlate-$plate-$mjd.fits file from
the DAS and extract this 'imaging region' from HDU#7 to access
these numbers.
The u and z synthetic magnitudes are generally not to be used since,
as mentioned above, the overlap of the wavelength coverage of the
spectrographs with these filter bandpasses is minimal.
Note that the DR5 CAS has correct g,r,i synthetic values
in mag_0,mag_1,mag_2, however, an older version of the
spectroscopic pipeline was used to process these data
and the handling of reddening is different.
Also note that the synthetic magnitude values may need an
AB correction applied to put them onto the SDSS gri system.
The spSpec-$mjd-$plate-$fiber.fit files have header keywords
MAG_G, MAG_R, MAG_I which are intended to be the same as
mag_0, mag_1, mag_2 in the specObjAll table of the CAS.
These synthetic numbers are also 'shifted by one filter'
in DR6, thus, they actually are
synthetic mags u, g and r (instead of g,r, and i) respectively.
It will be corrected for the DR7 release of the
DAS and CAS.
Bug in Primtarget Flag in many SEGUE spectra
The Primtarget flag in many SEGUE spectra, as well as in many 'south22'
program plates, is truncated, so that the trailing digit is missing
and the whole of the number is shifted down by a factor of 10.
Thus, a Primtarget of -2147483584 is listed in the CAS database as
-214748358. This will be corrected in DR7 release. The correct
values of this field may be found in HDU#5 of the spPlate files
in the DAS.
Offset in spectrophotometric flux scale for 28 plate/MJD combinations in
DR6
The following list of 28 DR6 plate/mjd pairs was processed through
the new spectroscopic reductions (spectro v5_3) without a
640-line tsObj file for the photo psf magnitudes. In this case, the
pipeline reverts to the fiber magnitudes in the plPlugMap file and
thus the overall spectrophotometry are too faint by 0.35 mags for
objects on these plates relative to other plates.
Plate MJD
---------
269 51910
270 51909
277 51908
284 51943
309 51666
324 51666
336 51999
345 51690
349 51699
353 51703
367 51997
394 51913
403 51871
446 51899
460 51924
492 51955
543 52017
554 52000
556 51991
616 52374
616 52442
683 52524
730 52466
830 52293
872 52339
1394 53108
1414 53135
1453 53084
Redshift status
Only 1% of the objects have an "unknown" classification, usually
because of low signal-to-noise ratio or completely featureless
spectra. The redshifts of all but a few tenths of a percent of the
remainder are believed to be correct. To identify the few
objects with unreliable redshifts, be sure to consider the confidence
we have assigned to each redshift (z_conf in the spSpec*.fits primary header,
and the status zStatus
and zWarnin
of the redshift measurement, which may have failed.). A
useful cut on the redshift confidence is z_conf > 0.35
(or zConf > 0.35 in the SQL database).
Zero equivalent width of emission lines, especially H alpha
There is a bug in the line-measurement code that has been in use
since DR3 which gives some emission lines an equivalent width of zero,
even though there is a significant line detection. The aim of the
change introducing the bug had been to determine the equivalent width
by integrating the spectrum, instead of using the parameters of a
fitted Gaussian. The Gauss-fit equivalent width can be recovered from the
fit parameters using the usual expression EW = 2.5066 * sigma *
height / continuum.
Main survey spectra which are not marked sciencePrimary =
1 in CAS
Due to a bug in the pipelines, there are no tsTargets*.fits files for
plates 1617-1620, and 1623. As a consequence, the objects from
this plates do not have entries in the target and
targetInfo tables in the CAS. Hence they are not marked
sciencePrimary = 1 and do not appear in the default
specObj and specPhoto views, which provide a
filtered set of unique science spectra and form the basis of all
query interfaces. Use the specObjAll and and
specPhotoAll tables to access spectra from these plate
in the CAS.
Galactic extinction correction
In the EDR and DR1, the spectroscopic data were nominally corrected
for galactic extinction. The spectrophotometry since DR2 is vastly
improved compared to DR1, but the final calibrated spectra in DR2 and
beyond are not corrected for foreground Galactic reddening (a
relatively small effect; the median E(B-V) over the survey
is 0.034). Users of spectra should note that the fractional
improvement in spectrophotometry from DR1 to DR2 and beyond was much
greater than the extinction correction itself. As the SDSS includes a
substantial number of spectra of galactic stars, a decision has been
taken not to apply any extinction correction to
spectra, since it would only be appropriate for extragalactic objects,
but to report the observational result of the SDSS, namely, the
spectrum including galactic extinction.
Night sky emission lines
The night sky emission lines at 5577Å, (when there is auroral
activity) at 6300Å, 6363Å, and in the OH forest in the red
can be very strong, and leave significant residuals in the spectra
whose amplitude is occasionally underestimated by the noise model. Be
cautious about interpreting the reality of weak features close to
these lines.
Plates with not-quite-perfect spectrophotometry
A small number of plates, given in the list
of not-quite-perfect plates, suffered from a variety of minor
problems. The CCD frames for several plates suffered from a transient
electronic problem in the red camera in Spectrograph 2, causing the
columns of the CCD to be misaligned on readout. This was fixed in
software, and we believe the data to be reliable. Another set of
plates labeled "Spectrograph Collimation Problem" suffered
from having the spectrograph collimator improperly focused. This
problem caused a mismatch between the flatfields and the science
exposure instrumental profile shapes on the CCD in both the spatial
and wavelength directions, causing the optimal extraction process to
reject an excessive number of pixels. This problem was fixed in
software, and comparing overlapping objects from adjacent plates
confirms that the redshifts from these problematic plates are
unbiased. However, the spectra themselves should not be used for
precision work or spectrophotometry. Other plates have individual
problems as noted. E.g., during the exposure of one plate, light from
an LED somewhere on the telescope found its way to the spectrographs,
resulting in an artificial excess of light centered roughly at
6500Å; the spectrophotometry of this plate is quite poor.
Mismatches between spectra and photometric data
In a few cases, the fiber mapping failed which identifies which
fiber has been plugged into which hole. When this happens for two or
more objects on the sample plate, there is the possibility of wrong
matches between spectra and photometric objects. There are 123 objects
for which the mapping between object and spectrum cannot be
established ("unmapped fibers"); their ra/dec is listed as
-9999 in the spectroscopic data set but synthetic fiber magnitudes
(mag_0, mag_1, mag_2 in the specObj tables
in the CAS, mag_g, mag_r, mag_i in the
spSpec*.fit files) greater than 0 (i.e., use the
synthetic magnitudes to distinguish the unmapped fibers from the 2221
fibers which were broken completely at the time of observations and
did not yield a spectrum at all).
Errors in the deblending algorithm in the target reductions
caused spectroscopy to be carried out occasionally on non-existent
objects (e.g., diffraction spikes of bright stars or satellite
trails). Many of these objects no longer exist in the best
imaging reductions with its improvements to the deblender. In other
cases, the photometric pipeline timed out during the best
imaging reductions in fields for which target imaging proceeded
without problem, so that the best photometry is missing for
bona-fide objects. This predominantly happens in fields close to a few
very bright stars. We expect to recover objects from these ``timeout
holes'' in future data releases.
The special plates have special issues
regarding photometric matches. Some of the special plates were
targeted using photometry that is not part of DR6, or not even SDSS
photometry. Therefore, the SDSS photometry for objects on plates 797,
1468, 1471, 1472, 1665, and 1666 is only available through DRsup.
In addition, special plates with SDSS photometry are different from
regular SDSS plates in that they have no tiling information associated
with them. Therefore, the specPhotoAll table is not
populated with all entries from special plates. Moreover, the SEGUE
low-latitude scans are loaded into a separate database
SEGUEDR6 in the CAS in order to keep BESTDR6
a homogeneous database of the high-latitude extragalactic
sky. Querying SEGUE data is explained in a SEGUE sample SQL
query.
To obtain photometric information for non-SEGUE special-plate
spectra, perform the following join:
select columns
from specObjAll as so
inner join photoObj as po on so.bestobjid = po.objid
Galaxy velocity dispersion measurements
The velocity dispersion measurements distributed with SDSS spectra
use template spectra convolved to a maximum sigma of 420
km/s. Therefore, velocity dispersion sigma > 420 km/s are not
reliable and must not be used. The figure below shows the quality of
velocity dispersion error estimates.
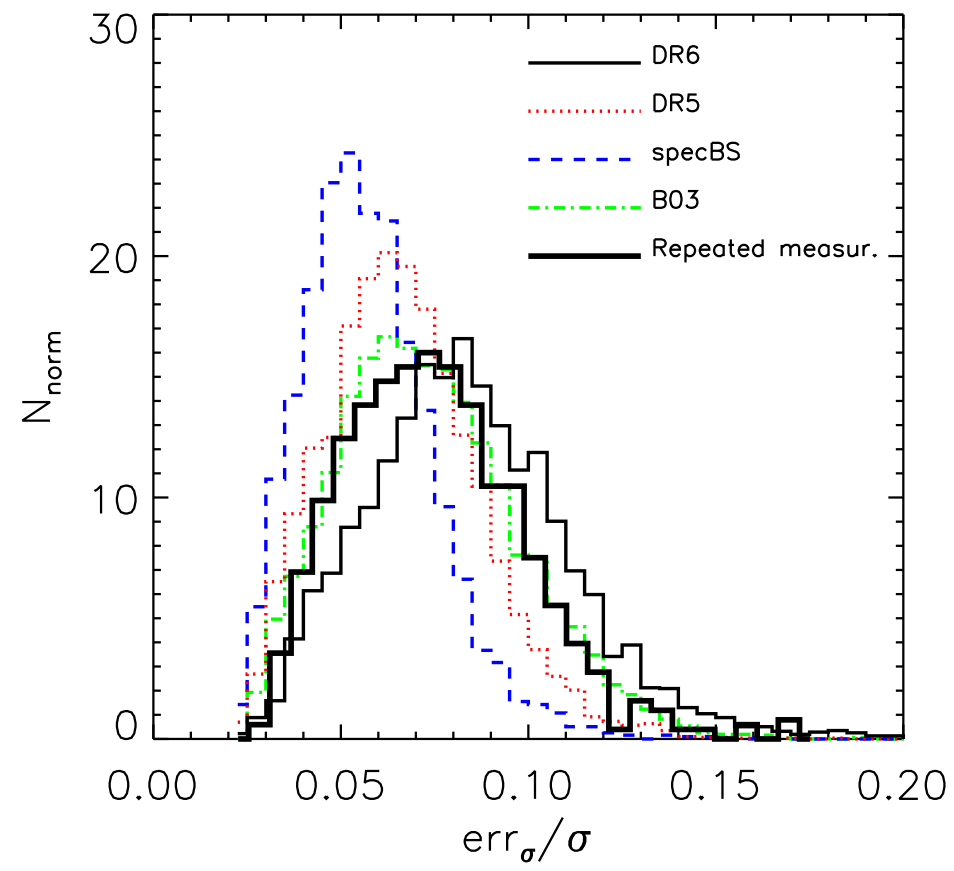 Error distribution of the velocity dispersion
measurements from spectro1d DR6 (thin black solid line), spectro1d DR5
(dotted red line), specBS (dashed blue line), and B03 (dotted-dashed
green line). The thick solid line was obtained by comparing repeated
measurements.
We recommend the user to not use SDSS velocity dispersion measurements
for:
- spectra with median per-pixel S/N < 10
- velocity dispersion estimates smaller than about 70 km s-1
given the typical S/N and the instrumental resolution of the SDSS
spectra
Also note that the velocity dispersion measurements are not corrected to a
standard relative circular aperture.
See the velocity dispersion
algorithm for details.
"Bonus" plates beyond the survey limits
A few plates target objects beyond the survey limits for a
particular survey stripe, stripe 10 (see survey coverage page). These
plate/MJD combinations are:
| Plate | MJD |
| 343 | 51692 (straddles stripe limits) |
| 344 | 51693 |
| 345 | 51690 |
| 346 | 51693 |
| 348 | 51671 |
| 364 | 52000 |
Their corresponding targetimaging data does not
contain any PRIMARY objects. Objects from this region are
therefore not available via a normal search of the target
object lists. To find the target data, select on status &
0x402 (both GOOD and OK_SCANLINE)
instead of selecting on the PRIMARY flag being set in
status. The information is also contained in the
spObj-*.fit files, which are available for all plates.
These files are available via the DAS by requesting the
data product tsObjFromMap (or spObj) for the plates you
wish. They are also available for bulk rsync or wget download via DAS through http (in
spectro/ss_SPRERUN/PLATE/spObj-*).
These objects have been declared primary in the
best data set. The CAS correctly records the positional
matches between these spectra and their counterparts in
best. However, since the corresponding targets are not
primary, the spectra are not included in the specObj and
specPhoto views in the CAS, but must be searched
explicitly in specObjAll and
photoObjAll.
Accuracy of stellar radial velocities
The accuracy of stellar radial
velocities in DR2/DR3 and beyond is described on a separate page.
Last modified: Sun Jul 15 16:08:14 CEST 2007
|