
| Home |
| Where to Start |
| About DR6 |
| News and Updates |
| Tutorials |
| Data Products |
| Data Access |
| Sky Coverage |
| Instruments |
| Data Flow |
| Algorithms |
| Glossary |
| Known Problems |
| Help and Feedback |
| Search |
 |
The SDSS Data Release 6 (DR6)ContentsNew for DR6DR6 is the first release since DR2 to have significant changes to the processing software. As it includes the first data from SDSS-II, it also adds substantially different data products - see About SEGUE and the public data release from the SDSS Supernova Survey. The qualitatively new items are:
The quantitatively new items are:
Except for the changes in the spectroscopic pipeline
What DR6 containsThe DR6 imaging data cover about 8420 square degrees of "legacy" sky, with information on roughly 230 million distinct photometric objects, and about 1200 square degrees of SEGUE sky, with about 57 million objects. The DR6 spectroscopic data include data from 1520 main survey plates of 640 spectra each, and cover 6860 square degrees. In addition, DR6 contains 467 "extra" and "special" plates:
There is a separate page describing the special plates in DR6 The DR6 footprint is defined by all non-repeating survey-quality imaging runs within the a priori defined elliptical survey area in the Nothern Galactic Cap, and three stripes in the Southern Galactic Cap obtained prior to 7 July 2006, and the spectroscopy associated with that area as well as the extra and special plates obtained before that date. In fact, 34 square degrees of imaging data in the Nothern Galactic Cap lie outside this ellipse. While the DR6 scans do not repeat a given area of sky, they do overlap to some extent, and the data in the overlaps are included in earlier releases as well. The sky coverage of the imaging and spectroscopic data that make up DR6 are given on the coverage page. The natural unit of imaging data is a run; the DR6 contains data from (about) 244 runs in the best database, and (about) 246 runs in the target database. A total of 183 square degrees of sky are different runs between target and best, the majority along the Equatorial Stripe in the Fall sky. We also make available images and associated catalogs from three categories of special runs as a DRsup (supplemental) DAS-only data release. They are:
Imaging caveatsThe following caveat is new to DR6. Systematic relative photometry errors in extreme-coloured starsStars with extreme colours can have inconsistent photometry due to slight differences in the photometric response for different camcols. There is a brief description in Ivezic et al. 2007, AJ in press. The following caveat has been characterised quantitatively now: Overestimation of sky levels in the vicinity of bright objectsBecause of scattered light (see the EDR paper [Stoughton et al. 2002]), the background sky in the SDSS images is non-uniform on arc-minute scales. The photometric pipeline determines the median sky value within each 100" square on a grid with 50" spacing, and bilinearly interpolates this sky value to each pixel. This biases the sky bright near large extended galaxies, and as was already reported in the DR4 paper and (Mandelbaum et al. 2005), causes a systematic decrease in the number density of faint objects near bright galaxies. In addition, it also strongly affects the photometry of the bright galaxies themselves, as has been reported by Lauer et al. (2007), Bernardi et al. (2007), and Lisker et al. (2007). We have quantified this effect by adding simulated galaxies (with exponential or de Vaucouleurs) profiles to SDSS images. The simulated galaxies ranged from apparent magnitude mr=12 to mr=19 in half-magnitude steps, with a one-to-one mapping from mr to Sersic half-light radius determined using the mean observed relation between these quantities for Main sample galaxies with exponential and de Vaucouleurs profiles. Axis ratios of 0.5 and 1 were used, with random position angle for the non-circular simulated galaxies. The results in the r band are shown in the Figure, showing the difference between the input magnitude and the model magnitude returned by the SDSS photometric pipeline, as a function of magnitude. Also shown is the fractional error in the scale size re. The biases are significant to r=16 for late-type galaxies, and to r=17.5 for early-type galaxies. Also shown is the results of a separate analysis by by Hyde & Bernardi (unpublished) who fit deVaucouleurs models to SDSS images of extended elliptical galaxies, using their own sky subtraction algorithm, which is less likely to overestimate the sky level near extended sources. Their results are quite consistent with the simulations. 
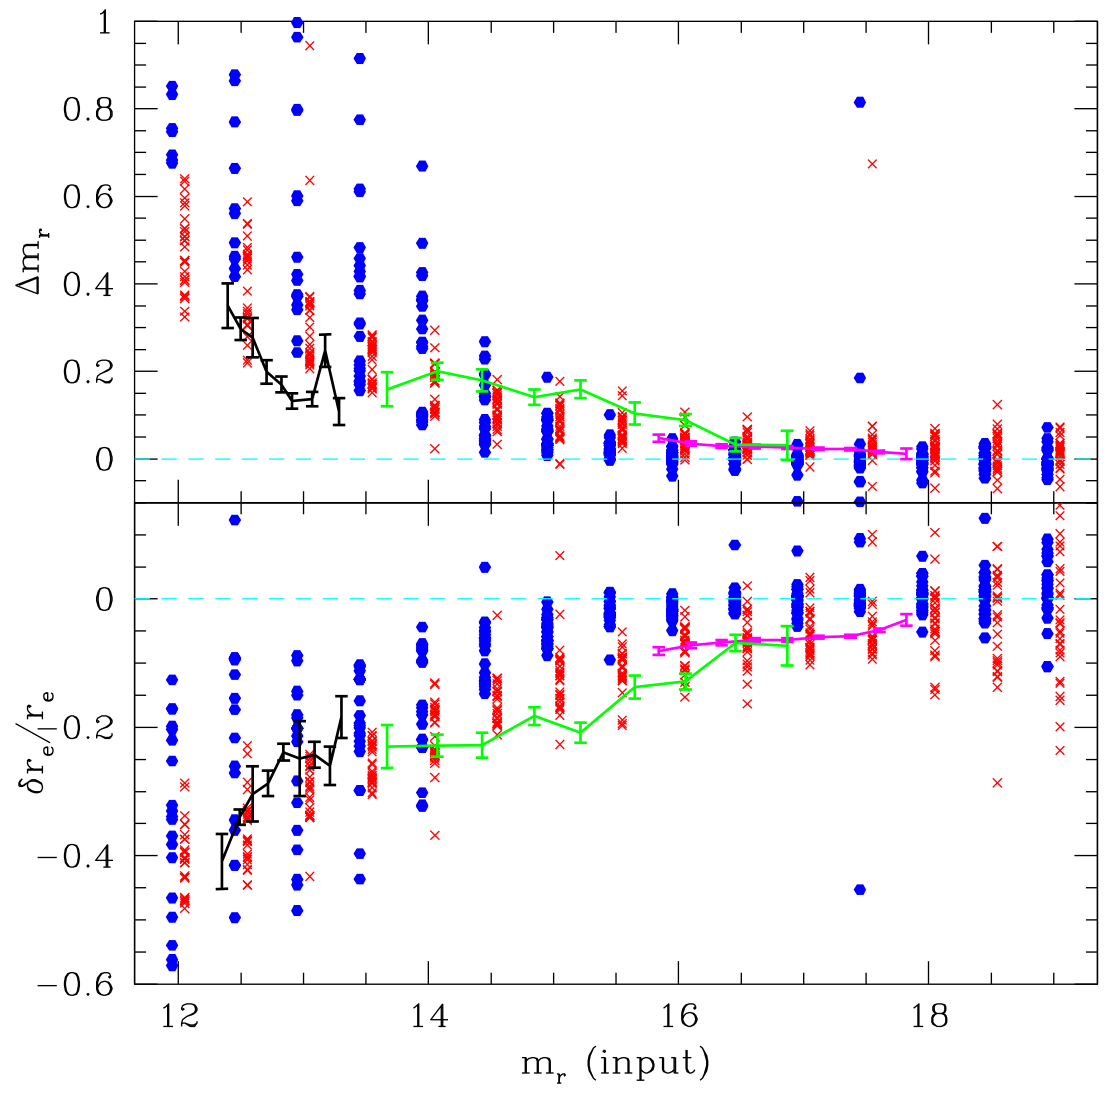
Upper panel: The error in the r band model magnitude of simulated galaxies with an n=1 (exponential) profile (blue hexagons) and an n=4 (de Vaucouleurs) profile (red crosses) as determined by the photometric pipeline, as a function of magnitude. Fifteen galaxies are simulated at each magnitude for each profile. Also shown are the analogous results from Hyde & Bernardi (unpublished) for three early-type galaxy samples: 54 nearby (z<0.03) early-type galaxies from the ENEAR catalog (da Costa et al. 2000) in black; 280 brightest cluster galaxies from the C4 catalog (Miller et al. 2005) in green; and 9000 early-type galaxies from the Bernardi et al. (2003a) analysis in magenta. Lower panel: The fractional error in the scale size re as a function of magnitude from the simulations and the Hyde & Bernardi analysis. The following caveats apply unchanged to DR6. Red leak to the u filter and very red objectsThe u filter has a natural red leak around 7100 Å which is supposed to be blocked by an interference coating. However, under the vacuum in the camera, the wavelength cutoff of the interference coating has shifted redward (see the discussion in the EDR paper), allowing some of this red leak through. The extent of this contamination is different for each camera column. It is not completely clear if the effect is deterministic; there is some evidence that it is variable from one run to another with very similar conditions in a given camera column. Roughly speaking, however, this is a 0.02 magnitude effect in the u magnitudes for mid-K stars (and galaxies of similar color), increasing to 0.06 magnitude for M0 stars (r-i ~ 0.5), 0.2 magnitude at r-i ~ 1.2, and 0.3 magnitude at r-i = 1.5. There is a large dispersion in the red leak for the redder stars, caused by three effects:
To make matters even more complicated, this is a detector effect. This means that it is not the real i and z which drive the excess, but the instrumental colors (i.e., including the effects of atmospheric extinction), so the leak is worse at high airmass, when the true ultraviolet flux is heavily absorbed but the infrared flux is relatively unaffected. Given these complications, we cannot recommend a specific correction to the u-band magnitudes of red stars, and warn the user of these data about over-interpreting results on colors involving the u band for stars later than K. Bias in sky determinationThere is a slight and only recently recognized downward bias in the determination of the sky level in the photometry, at the level of roughly 0.1 DN per pixel. This is apparent if one compares large-aperture and PSF photometry of faint stars; the bias is of order 29 mag arcsec-2 in r. This, together with scattered light problems in the u band, can cause of order 10% errors in the u band Petrosian fluxes of large galaxies. Zeropoint of the photometric systemThe SDSS photometry is intended to be on the AB system (Oke & Gunn 1983), by which a magnitude 0 object should have the same counts as a source of Fnu = 3631 Jy. However, this is known not to be exactly true, such that the photometric zeropoints are slightly off the AB standard. We continue to work to pin down these shifts. Our present estimate, based on comparison to the STIS standards of Bohlin, Dickinson, & Calzetti~(2001) and confirmed by SDSS photometry and spectroscopy of fainter hot white dwarfs, is that the u band zeropoint is in error by 0.04 mag, uAB = uSDSS - 0.04 mag, and that g, r, and i are close to AB. These statements are certainly not precise to better than 0.01 mag; in addition, they depend critically on the system response of the SDSS 2.5-meter, which was measured by Doi et al. (2004, in preparation). The z band zeropoint is not as certain at this time, but there is mild evidence that it may be shifted by about 0.02 mag in the sense zAB = zSDSS + 0.02 mag. The large shift in the u band was expected because the adopted magnitude of the SDSS standard BD+17 in Fukugita et al.(1996) was computed at zero airmass, thereby making the assumed u response bluer than that of the USNO system response. Holes in the imaging dataAbout 0.3% of the DR6 imaging footprint area
(about 25 square degrees) for DR6 are marked as
holes. These are indicated in the CAS by setting
Problems with one u chipThe u chip in the third column of the camera is read out
on two amplifiers. On occasion, electronic problems on this chip
caused one of the two amplifiers to fail, meaning that half the chip
has no detected objects on it. This was a problem for only two of the
105 imaging runs included in DR5: run 2190, which includes a total of
360 frames in two separate contiguous pieces on strip 12N (centered
roughly at delta = +5 degrees in the North Galactic Cap; NGC), and run
2189, which includes 76 frames on stripe 36N near the northern
boundary of the contiguous area in the NGC. The relevant frames are
flagged as bad in the Spectroscopy caveatsProblematic plates (new: flux scale offset for 28 plates)A small number of plates suffered from a variety of minor problems affecting the quality of the spectrophotometry (but not of redshifts). See the list under Plates with problematic spectrophotometry on the data products page for spectra. A problem new to DR6 is that 28 plate/MJD combinations have an offset in their spectrophotometric flux scale. See spectrophotometry flux scale offset caveat. Zero equivalent width of emission lines, especially H alphaThere is a bug in the line-measurement code that has been in use
since DR3 which gives some emission lines an equivalent width of zero,
even though there is a significant line detection. The aim of the
change introducing the bug had been to determine the equivalent width
by integrating the spectrum, instead of using the parameters of a
fitted Gaussian. The Gauss-fit equivalent width can be recovered from the
fit parameters using the usual expression Note about galactic extinction correctionIn the EDR and DR1, the spectroscopic data were nominally corrected for galactic extinction. The spectrophotometry since DR2 is vastly improved compared to DR1, but the final calibrated spectra in DR2 and beyond are not corrected for foreground Galactic reddening (a relatively small effect; the median E(B-V) over the survey is 0.034). Users of spectra should note that the fractional improvement in spectrophotometry from DR1 to DR2 and beyond was much greater than the extinction correction itself. As the SDSS includes a substantial number of spectra of galactic stars, a decision has been taken not to apply any extinction correction to spectra, since it would only be appropriate for extragalactic objects, but to report the observational result of the SDSS, namely, the spectrum including galactic extinction. Mismatches between the spectroscopic and imaging dataFor various reasons, a small fraction of the spectroscopic objects
do not have a counterpart in the Something in this file was modified on $Date: 2007/07/12 19:26:26 $ (UT) |