

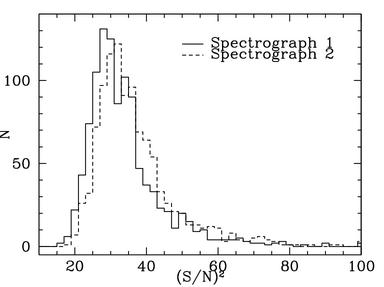
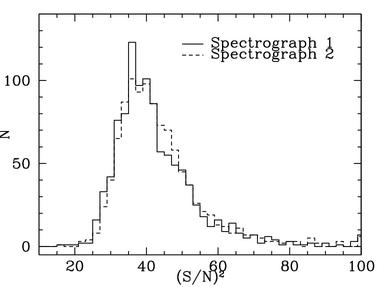
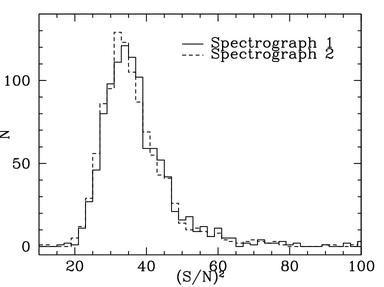
Spectroscopic signal to noise of galaxy samplesUp: SpectraDistribution of signal to noise in 1052 DR4 regular survey platesThe SDSS uses two identical multi-object fiber spectrographs. Below is a comparison of the two spectrographs in each of the three bands that span the spectroscopes' range in wavelength. The histograms show (S/N)2 in bins of 2.
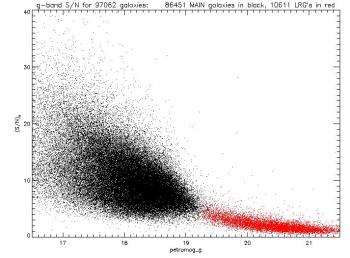
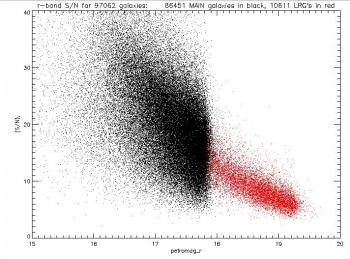
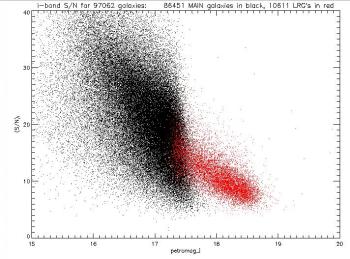
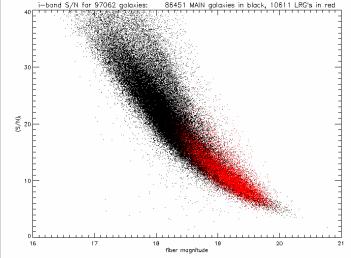
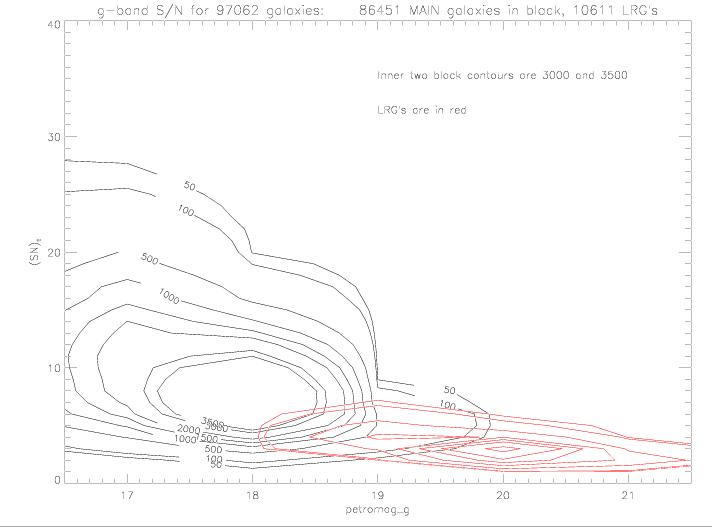
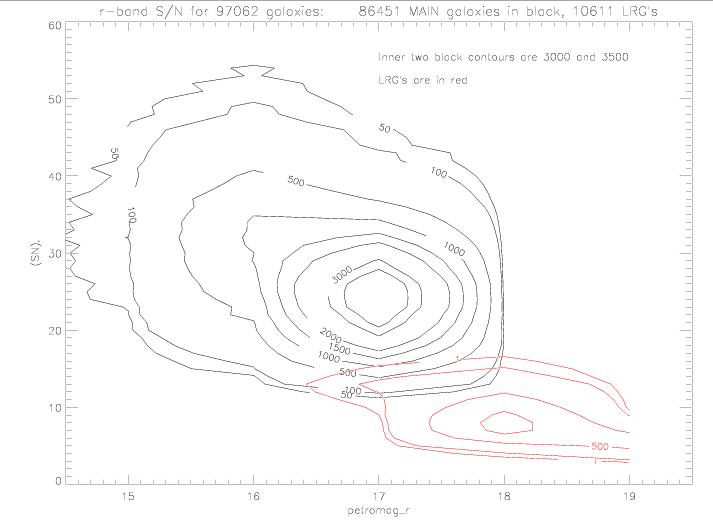
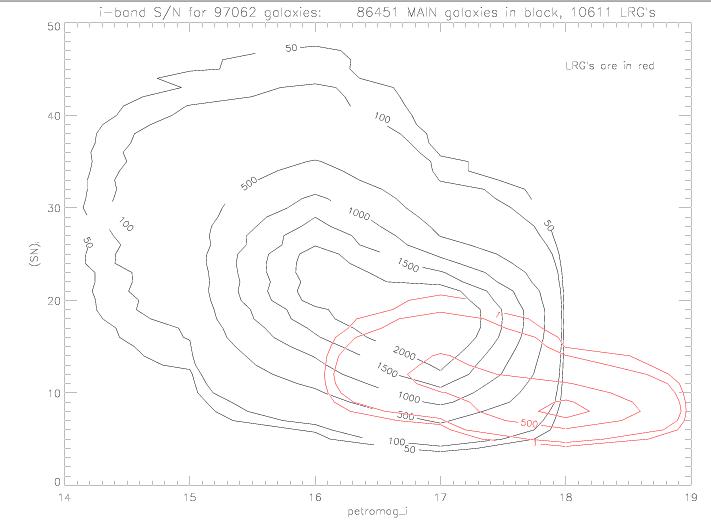
Signal to noise as a function of magnitudeSignal to noise in each of the three spectroscopic bands as a function of petrosian magnitude in that band, for DR1 objects. Clicking on the image will enlarge it. Links to contour histograms are under each plot. MAIN sample galaxies are in black and LRG's are in red. The sharp cutoff in MAIN galaxies in the r-band is a result of the magnitude limit placed on target galaxies. Note that all of the following plots are of S/N and not (S/N)2.
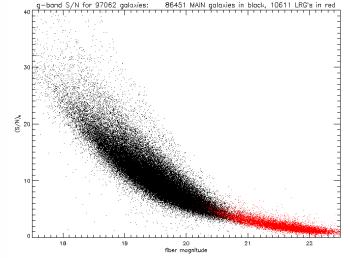
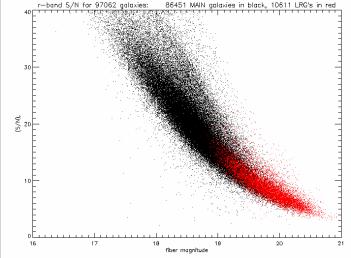
Alternatively, one could ask how the signal-to-noise depends on the fiber magnitudes.
Last modified: Tue Jul 26 21:14:23 CDT 2005 |