I. INTRODUCTION
With the completion of the installation of the major components of the fiber mapper hardware in early 1998, a visit was made to APO in February, 1998 to install and shakedown the system. A key prerequisite of this work was that a full fiber harness be installed and plugged. Moreover, both slit heads were mounted which permitted, for the first time, an extension of the mapping algorithm to the full system.
During the visit, the full system was implemented and the first full scans were made. While a number of problems were discovered and resolved, a few new issues have arisen which need further work. The progress and remaining issues will be covered in the following.
The software is designed to perform the following functions.
1.) Find the ends of the harnesses of each slit head and establish a reference point.
2.) Carry out a full fiber scan (typically five steps per fiber) to determine the fiber centers and store the results in a file called Map.In.
3.) Find the centers of the fibers using the information in Step (2.)
4.) Carry out a centered fiber scan, stepping from center-to-center of each fiber on both slit heads.
5.) Store the (x,y) coordinates of the centered fiber scan (Step 4.) in a file called Map.Out.
6.) Carry out a scaling and rotation of the Map.Out data, using a least squares fitting algorithm or other method.
7.) Prepare a map file in standard format.
8.) Check for missing fibers or other anomalies.
9.) Provide reset, clear and other functions as needed.
II. MAPPER HARDWARE PROGRESS
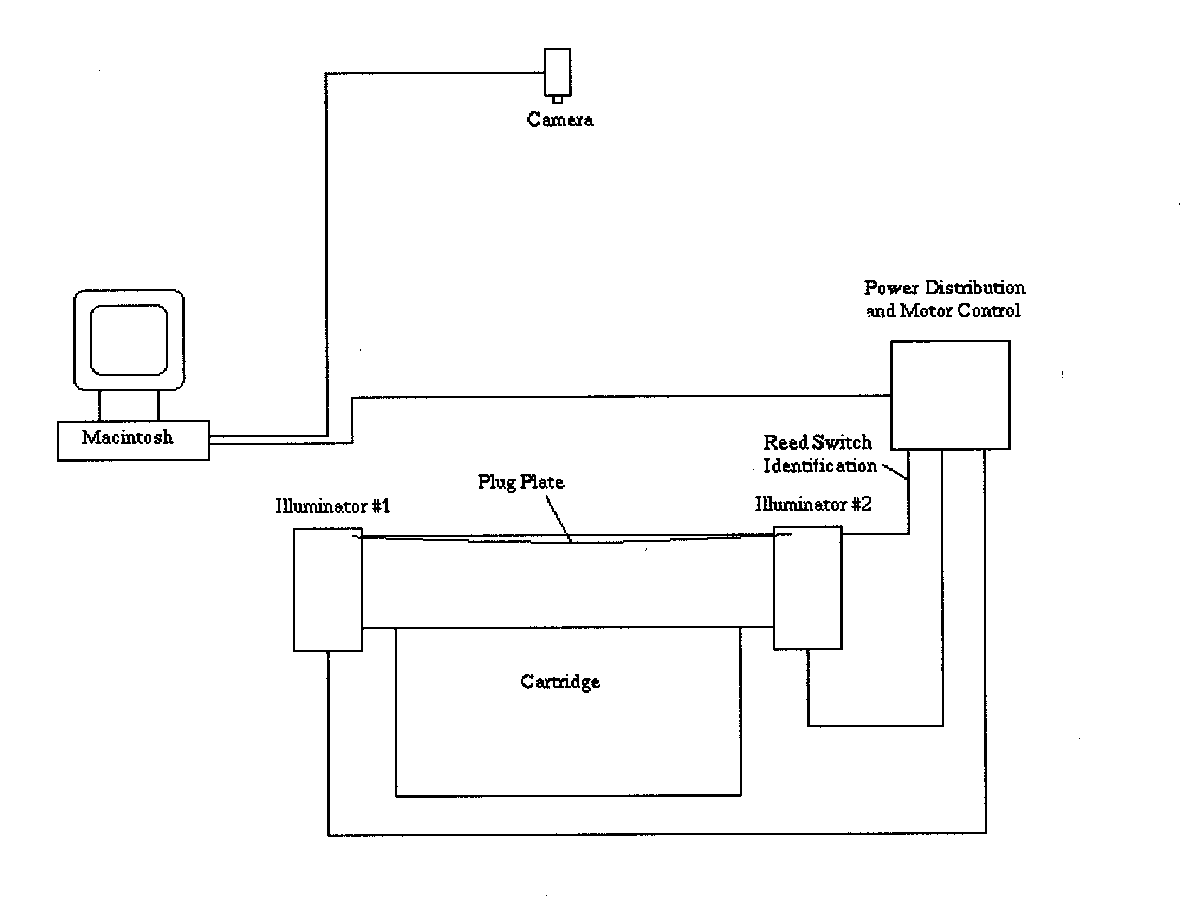
The installed hardware now includes two full slit heads, two illuminators, camera and Macintosh with frame grabber for processing the mapping data, as shown in Fig. 1. A prototype version of the mapping software is also in place.
The hardware for the cartridge identification system was installed, but we were unable to address the IO device which was based on IEEE-488 protocol. (this was obtained free as a trial unit from another project). A replacement unit was ordered and the power and cabling for the unit was completed.

FIG. 1. Block Diagram of the Fiber Mapper System
III. MAPPER SOFTWARE PROGRESS
Since this was the first time that both slit heads and full harnesses had been available, most of the visit was devoted to extending the previous single-slit head software. An automatic algorithm was implemented to (a) access separate illuminators (b) find the ends of the separate slit heads (c) sequentially carry out a full fiber scan and (d) sequentially carry out a centered fiber scan.
A number of issues were encountered that were only present with a full cartridge, including array sizes and integer ranges. These were investigated and resolved. At the present time, there are no known restrictions on the scan parameters, and all code features are functional with two full slit heads. Improvements were also made to the user interface.
IV. SCAN RESULTS
Results of a full scan of the fibers of harness #1 are shown in Fig. 2. A closeup of the scan, shown in Fig. 3 shows that the minimum noise level between lines is approximately 100-200 counts. It can be assumed that this level exists for all positions across the scan. It is to be noted that the periodic gaps in the scan data represent the gaps between harness bundles. Since the center-finding routine is based on a smoothed differentiation method, choosing a threshold value of approximately 80-100 counts leads to a more noise free center-finding algorithm. It is also noted in Fig. 3 that the variation of the intensity in adjacent fibers is rather large.
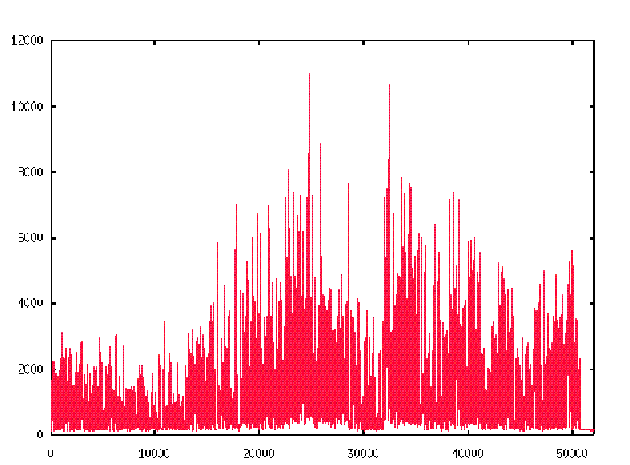
FIG. 2. Full scan of Slit Head #1. A factor of four variation in the intensity is observed across the harness array.
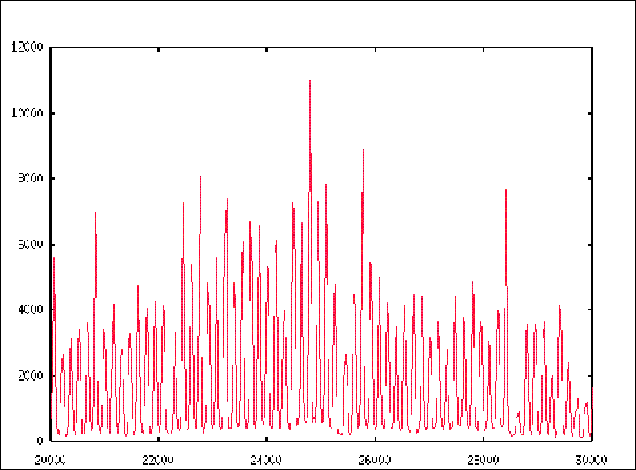
FIG. 3. Full scan of Slit Head #1. A zoom of the full scan shown in the previous figure. Gaps occur in the scan data corresponding to the gaps between harness bundles
Once the fiber centers have been found, the Map.In file contains the number of motor steps between adjacent fibers. The distribution of intervals for the entire harness is shown in Fig. 4. While most of the intervals occur at one specific value, a small number exceed this value, presumably due to the gaps between the fiber harnesses.
We carried out a series of mechanical stability tests by removing and remounting each illuminator several times, then carrying out a scan of the fiber centers. We did not detect any errors due to misalignment, so the mechanical stability appears to be adequate.
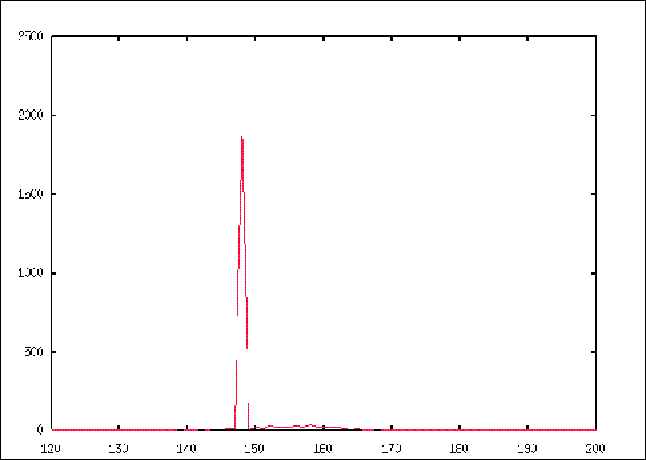
FIG. 4. Distribution of intervals between fibers.}
In Fig.5 the mapped locations of the fibers are shown on a two-dimensional grid. (The missing fibers at the lower left are due to the fact that the remaining fibers could not reach those holes. Presumably, some practice in plugging the plates will eliminate this situation.)
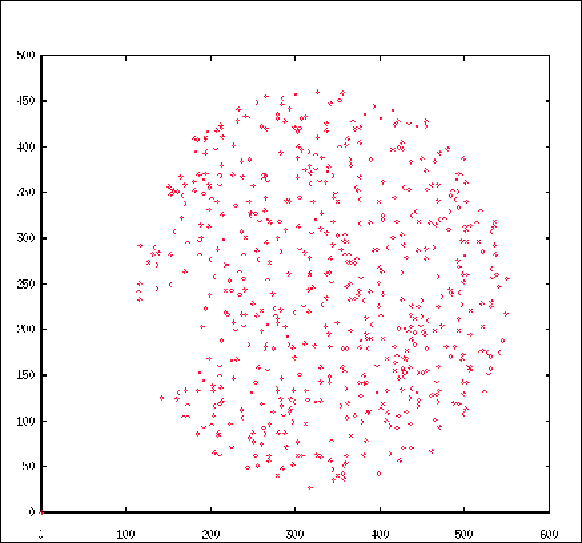
FIG. 5. X-Y plot of mapped coordinate locations
V. REMAINING ISSUES
A. Fiber Intensity Variation
We have observed strong intensity variation across the fiber harness array both on the prototype at Fermilab and on the installed system at APO. In lab tests at the University of Washington, variation from fiber to fiber was measured to be only a few percent. In our field measurements, we see a factor of about four. We have attributed this in the past to fiber alignment and cleanliness. Since the laser beam optics forms a telescope with restricted angular acceptance, any slight variation in the fiber end alignment may cause an apparent intensity variation in the result which does not occur in the actual spectrometer image. This situation needs to be further clarified.
Cleanliness of the fiber ends may also be an issue. Some improvement was made in tests where the fibers ends were carefully cleaned with an alcohol solvent before plugging. However, the variation in intensity was reduced, but not eliminated. It is our understanding that the fiber ends were not cleaned before plugging for the data gathered for this report. Therefore, it is to be expected that the variation will be less under carefully controlled field conditions. One possible solution is that a type of clean room be set up around the mapping station to maintain clean fibers. Also, a study needs to be carried out to determine the best procedure for periodically cleaning the fiber ends.
Another alignment problem concerns the rather narrow beam of the laser in the illuminator. As seen in Fig. 2, there is an overall trend for the intensities to be low at one end of the harness array. This is likely due to a slight misalingment of the plane of the harnesses with the track of the laser illuminator. This could be adjusted mechanically, however, a more suitable approach would be to broaden the laser beam in the horizontal plane using a cylindrical lens. This will be tried in the near future.
B. Scaling Issues
In order to test the scaling algorithm, we obtained a plugplate drilling file for the plate installed from the University of Washington. The coordinates of the holes are given in inches, including a number of guidestar holes (slightly larger size). The Map.Out data is in terms of pixel coordinates and must be scaled (and rotated) to match the drilling file information.
The problem comes with not knowing apriori the effective origin (center) of the plug plate, nor its angular rotation. In order to reduce the difficulty of this two-parameter search, the map data is first scaled to have the same RMS value as the drill file and the median of both data sets is found. Then a rotation of one set relative to the other is carried out to determine the best fit as a function of rotation angle. The results of such a rotation procedure are shown in Fig.6.
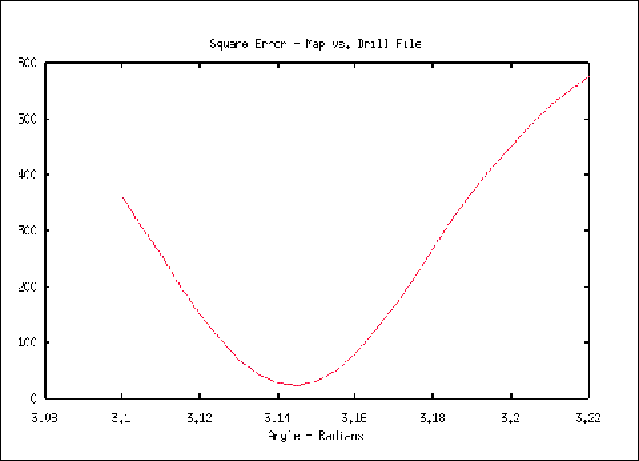
Fig.6. Square error due to rotation of the map data relative to the drill file data.
We note that a sharp minimum in the square error is obtained as a function of the rotation angle, which permits a determination of the orientation of the map data to within about 1/2 degree. In order to obtain this fit, a slight asymmetric compression of the data was required (the horizontal compression factor was .94 and the vertical compression factor was .97). Moreover, the data was rotated by about 180 degrees relative to the drill file coordinates. In Fig. 7 the data sets are shown overlaid. The green points are the drill file holes and the red points are the mapped holes, indicating about 100 holes were not mapped, and therefore not identified. Most of thes holes were actually not plugged, however, about 30 holes were not mapped because of low light transmission.
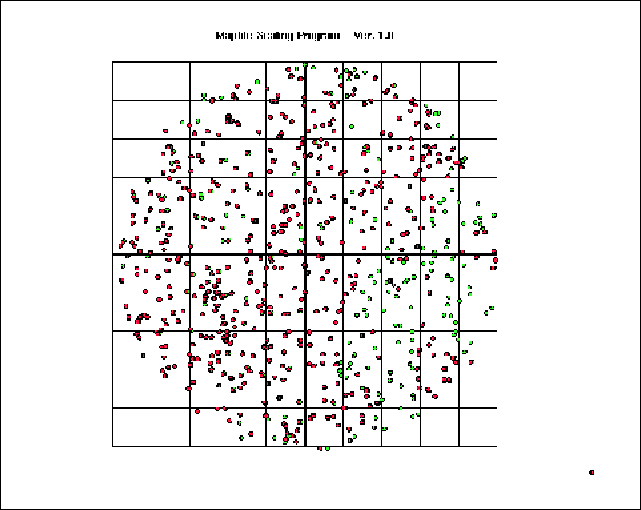
FIG. 7.Overlay of drill file data (green) and map data (red). The green points showing correspond to drilled holes that were not found, either because the light transmission was too low, or they were not plugged.
It should also be noted that a slight shift of the map data was also required for the best fit. Both the shift and the scaling of the data should remain fixed for a given configuration. As such, this appears to be an adequate fit, provided the missing fiber issue is addressed.
C. Conclusions
The following recomendations are made for improving the performance of the mapper system:
1.) Carry out a study of fiber cleaning procedures to ensure optimal light transmission
2.) Install a cylindrical lens in the illuminators to reduce alignment tolerances of the laser beam