|
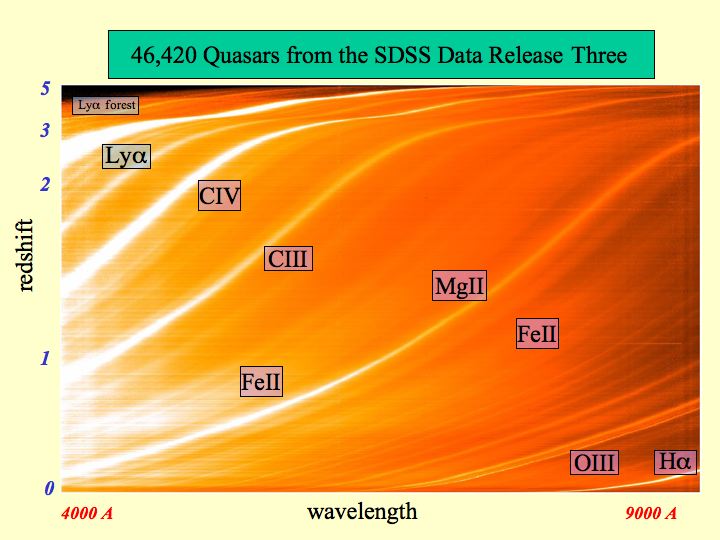
In addition to images, the SDSS has measured the spectra of
light from more than a million celestial sources. The spectrum
of an object shows the intensity of its light as a function of
wavelength. This picture shows the spectra of more than 46,000
quasars from the SDSS 3rd data release; each spectrum has been
converted to a single horizontal line, and they are stacked one above the other with the
closest quasars at the bottom and
the most distant quasars at the top. Bright bands show the emission
produced by specific ions of hydrogen, carbon, oxygen, magnesium,
and iron. For more distant quasars, these emission lines are
shifted to longer wavelengths by the expansion of the universe.
This redshift of spectral lines is what the SDSS measures to determine the distances to
quasars and galaxies.
|