
| SDSS Classic |
| SDSS.org |
| SDSS4.org |
| SDSS3.org |
| SDSS Data |
| DR19 |
| DR17 |
| DR10 |
| DR7 |
| Science |
| Press Releases |
| Education |
| Image Gallery |
| Legacy Survey |
| SEGUE |
| Supernova Survey |
| Collaboration |
| Publications |
| Contact Us |
| Search |
Asteroid Belt Cross Section
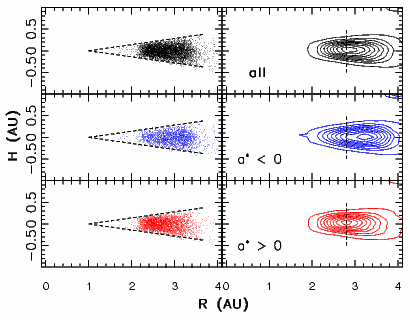
The graph shows the cross section of the asteroid belt. In the left
column each asteroid is shown as a dot, and in the right column the
distribution is outlined by isodensity contours. The top panels show the
whole sample, and the other panels show each color type separately (blue
is carbonaceous, red is rocky). The two dashed lines in the left column
show the observational limits. The vertical dashed lines in the right
column show the position of the highest asteroid density for the rocky
(red) subsample and are added to guide the eye. Note that the
distributions of the two asteroid types are significantly different.
Image credit: Tom Quinn and Zeljko Ivezic, SDSS Collaboration
This image is also available as a PostScript file (135 KB).