
Algorithms - SpectrophotometryBecause the SDSS spectra are obtained through 3-arcsecond fibers
during non-photometric observing conditions, special techniques must
be employed to spectrophotometrically calibrate the data. In DR6,
there have been substantial improvements to the algorithms which
photometrically calibrate the spectra, and all spectra have been
re-reduced, with a new spectro rerun number (sometimes called
DR7 updatesCorrection of Instability in the Spectroscopic Flats
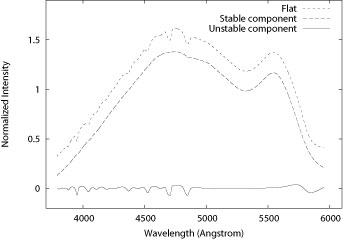
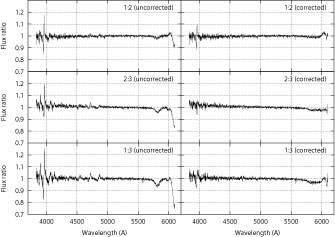
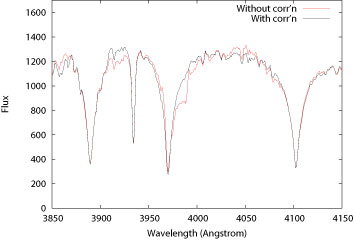
Spectroscopic flatfields for the blue camera in the first spectrograph contain an interference pattern produced by the dichroic. The thickness of the dichroic coating is believed to be sensitive to the ambient humidity, and moisture which enters the system during plate changes affects the instrument response, shifting the interference pattern in wavelength in unpredictable ways on timescales comparable to the 900 s exposure time. The flats applied in processing were exposed several minutes prior to, or after, the science frames and therefore were not always representative of the true instrument response at the time of exposure. The interference pattern is most pronounced in the 3800-4100 Å region of the spectrum and, when shifted during exposure, causes significant distortion of the H and K Calcium lines in stellar spectra, systematically affecting estimates of metallicities and surface temperatures. Flats obtained under different conditions were used to identify and model the stable and unstable (shifting) components of the flat, as shown in the Figure A (Figure 7 of the Data Release 7 paper*). With this model in hand, we looked for shifts in the interference pattern over the typically 45 minute time a given plate was observed by comparing the results of the individual 15-minute exposures for each object. Thus, we took ratios of the extracted spectra from the separate exposures, and medianed them over all objects on a plate, giving results like those on the left-hand side of Figure B (Figure 8 of the Data Release 7 paper*). We fit this ratio to the results expected from a shifting interference pattern (essentially a derivative of the shifting component in Figure A), with the only free parameter being the amount of shift, and divided out this remaining component in each spectrum. The right-hand panel of Figure B shows that this technique removes the majority of the effects of the shifting interference. An example is shown in Figure C (Figure 9 of the Data Release 7 paper*), the spectrum of an A star observed on a place where the interference term was particularly bad, as is seen in DR6 and DR7. The shapes of the absorption lines, especially Hε at 3970 Å, is much more regular in the new reductions. DR6 updatesThe pipeline that extracts, combines, and calibrates the SDSS
spectra of individual objects from the two-dimensional spectrograms
( The new code has a different spectrophotometric calibration flux scale. The fiber magnitude reported by the photometric pipeline is the brightness of each object, as measured through a 3′′ diameter aperture corrected to 2′′ seeing to match the entrance aperture of the fibers (see the discussion in the EDR paper). However, the relationship between the fiber magnitudes of stars and the PSF magnitudes (which, for unresolved objects, is our best determination of a true, total magnitude) is dependent on seeing; this is made worse because the colors of stars measured via fiber magnitudes will be sensitive to the different seeing in the different filters (although cases in which the seeing is dramatically different in the different bands are fairly rare). With this in mind, the pipeline used in DR6 determines the spectrophotometric calibration on each plate such that the flux of the spectrum of standard stars integrated over the filter curve matches the PSF magnitude of the stars as measured from their imaging. This calibration is determined for each of the four cameras (two in each spectrograph) from observations of standard stars. Additional corrections to handle large-scale astrometric and chromatic terms are measured from isolated stars and galaxies of high S/N, and are then applied to all the objects on the plate. Unchanged since DR2/DR3The following items have remained unchanged since DR2/DR3, which had the previous major change of SDSS spectrophotometry calibration. Selection of spectroscopic standard starsOn each spectroscopic plate, 16 objects are targeted as spectroscopic standards. These objects are color-selected to be F8 subdwarfs, similar in spectral type to the SDSS primary standard BD+17 4708. 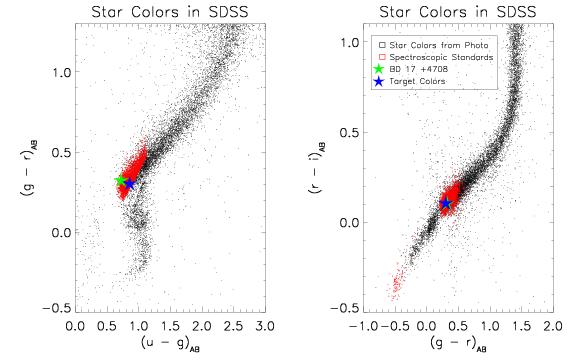
The color selection of the SDSS standard stars. Red points represent stars selected as spectroscopic standards. (Most are flux standards; the very blue stars in the right hand plot are"hot standards"used for telluric absorption correction.) The flux calibration of the spectra is handled by the Spectro2d pipeline. It is performed separately for each of the 2 spectrographs, hence each half-plate has its own calibration. In the EDR and DR1 Spectro2d calibration pipelines, fluxing was achieved by assuming that the mean spectrum of the stars on each half-plate was equivalent to a synthetic composite F8 subdwarf spectrum from Pickles (1998). In the reductions included in DR2/DR3, the spectrum of each standard star is spectrally typed by comparing with a grid of theoretical spectra generated from Kurucz model atmospheres (Kurucz 1992) using the spectral synthesis code SPECTRUM (Gray & Corbally 1994; Gray, Graham, & Hoyt 2001). The flux calibration vector is derived from the average ratio of each star (after correcting for Galactic reddening) and its best-fit model. Since the red and blue halves of the spectra are imaged onto separate CCDs, separate red and blue flux calibration vectors are produced. These will resemble the throughput curves under photometric conditions. Finally, the red and blue halves of each spectrum on each exposure are multiplied by the appropriate flux calibration vector. The spectra are then combined with bad pixel rejection and rebinned to a constant dispersion. 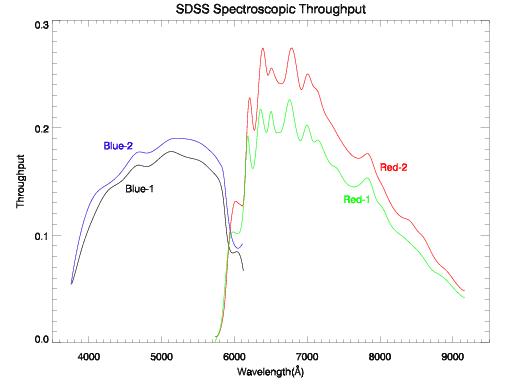
Throughput curves for the red and blue channels on the two SDSS spectrographs. Note about galactic extinction correctionIn the EDR and DR1, the spectroscopic data were nominally corrected for galactic extinction. The spectrophotometry since DR2 is vastly improved compared to DR1, but the final calibrated spectra in DR2 and beyond are not corrected for foreground Galactic reddening (a relatively small effect; the median E(B-V) over the survey is 0.034). Users of spectra should note that the fractional improvement in spectrophotometry from DR1 to DR2 and beyond was much greater than the extinction correction itself. As the SDSS includes a substantial number of spectra of galactic stars, a decision has been taken not to apply any extinction correction to spectra, since it would only be appropriate for extragalactic objects, but to report the observational result of the SDSS, namely, the spectrum including galactic extinction. *Text and figures on this page come from an author-created, un-copyedited version of the SDSS Data Release 7 paper, an article submitted to Astrophysical Journal Supplements. IOP Publishing Ltd is not responsible for any errors or omissions in this version of the manuscript or any version derived from it. A preprint of the DR7 paper is available from the arXiv preprint server. Last modified on $Date: 2009/02/12 19:49:02 $ (UT). |