SpectraUp: Data Products Sections: Images - Object lists - Spectra - Tiling Down: Quality of spectra - About SDSS spectra - Caveats DR7 contains completely reprocessed spectra.In DR7, there have been improvements to the algorithms which photometrically calibrate the spectra, and all spectra have been re-reduced. The new spectro "rerun number" is 26. About spectroscopic samplesNormal survey platesThe spectroscopic survey is predominantly a survey for
There is also a large number of spectra of stars. Brown dwarfs, ROSAT and FIRST counterparts are targetted as well. Refer to the target selection quality or target selection algorithm for details about the spectroscopic survey targets. Extra and special plates, including SEGUENew since DR4 is the publication of "extra" and "special" plates. Extra plates are repeat observations of normal survey plates. These have the same plate number as the original observation, but a different MJD and usually a different mapping between fiber number and ra,dec. Special plates are spectroscopic observations made under a variety of special programs which are described on the special spectra page. Note the caveat below about querying special-plate data in the CAS (including SEGUE). Getting and using spectraThe spectra distributed by the SDSS have been sky subtracted,
corrected for telluric absorption spectrophotometrically
calibrated by the Spectro2d pipeline. Spectral classification,
redshift determination, and emission and absorption line measurements
are carried out by the "1D" pipeline. DR7
contains the outputs from two independent 1D pipelines: the
The algorithms page contains details about spectroscopic data processing for all pipelines. Since DR1, the Data Archive Server has been providing the same spectrum in two files:
All of the above files are available through the DAS query form. DR7 provides additional spectroscopic data:
The specBS outputs are available through the DAS query form. The
Bulk download of spectra, spectroscopic parameters, and corresponding imaging dataVery often one wishes to obtain all the SDSS photometric (imaging camera) data associated with each spectrum. One can obtain this information most easily for nearly all plates through the SQS interface by selecting imaging parameters to return with your selected spectra. For those who prefer working with the full fits files of spectra
and imaging catalogs, make available a special set of files
( These files are available via
the DAS by requesting the data
product More on data accessThe data access page contains various query forms to get spectra by coordinates, or to search for spectra by redshift, object magnitude, color etc., and to retrieve them from the archive. In particular, the Catalog Archive Server provides a fast search capability for object lists and spectroscopic parameters as well as pointers to the files in the Data Archive Server, whose structure is explained on the Data Archive Server structure and contents page. The Spectro Query Server query form is dedicated to the search of the spectroscopic database. You can also download fits tables with the classification, redshifts and other information from the page with redshift catalogs and spectro+imaging data. Please note the caveats below, which are essential to obtain meaningful scientific results from analysing SDSS spectra, in particular the redshift status caveat. Quality of spectra
About the spectraFor details about the spectrographs, see the spectrograph page.
Further details
CaveatsDAS only platesA few Legacy and SEGUE plates either did not have sufficient exposure time to reach their target S/N in order to be declared 'done'. Also, in the case of SEGUE, 3 plates have bright but not faint equivalents (or vice-versa). These plates do not appear in the CAS or in the list of all plates, however, they are available in the DAS. The plate-mjd numbers for these plates are:plate-mjd Why not in CAS platex table: ----------------------------------------------------------------------- 0356-51779 S/N too low -- plate not done (not enough exposure) 1112-53180 S/N too low -- plate not done 1858-53271 SEGUE test plate, high DEC, never made it to CAS 2309-54441 S/N too low -- SEGUE plate 2333-53676 M71 very bright plate, lots of saturation, only 320/640 done 2535-54632 SEGUE bright, faint matching plate not done 2640-54474 BAOTest plate, test plate for SDSS-III 2716-54629 SEGUE bright, faint matching plate not done 2813-54650 SEGUE bright, insufficient S/N, plate not done 2851-54485 SEGUE dup pointing of plate 2045. 2962-54578 don't have correct tsObj file, Low S/N, plate not done Note on Radial VelocitiesThe DAS records ELODIE-matched template redshifts for all stars as the quantity elodie_z in the spZbest* file for each plate. The CAS records this as the quantity elodierv in the sppParams table in the BESTDR7 Context. The elodierv = c*elodie_z+7.3 km/s, where the 7.3 is an empirically derived offset putting the elodierv of all stars on a system consistent with that of other literature measures of known radial velocity standards. Two other redshifts, the specBS redshift and the Spectro redshift are available, unaltered, in the sppParams table (or spbsparams view). These redshifts, primarily for galaxy work, do not have the 7.3 km/s offset applied.Redshift status Only 1% of the objects have an "unknown" classification, usually
because of low signal-to-noise ratio or completely featureless
spectra. The redshifts of all but a few tenths of a percent of the
remainder are believed to be correct. To identify the few
objects with unreliable redshifts, be sure to consider the confidence
we have assigned to each redshift ( Zero equivalent width of emission lines, especially H alphaThere is a bug in the line-measurement code that has been in use
since DR3 which gives some emission lines an equivalent width of zero,
even though there is a significant line detection. The aim of the
change introducing the bug had been to determine the equivalent width
by integrating the spectrum, instead of using the parameters of a
fitted Gaussian. The Gauss-fit equivalent width can be recovered from the
fit parameters using the usual expression Galactic extinction correctionIn the EDR and DR1, the spectroscopic data were nominally corrected for galactic extinction. The spectrophotometry since DR2 is vastly improved compared to DR1, but the final calibrated spectra in DR2 and beyond are not corrected for foreground Galactic reddening (a relatively small effect; the median E(B-V) over the survey is 0.034). Users of spectra should note that the fractional improvement in spectrophotometry from DR1 to DR2 and beyond was much greater than the extinction correction itself. As the SDSS includes a substantial number of spectra of galactic stars, a decision has been taken not to apply any extinction correction to spectra, since it would only be appropriate for extragalactic objects, but to report the observational result of the SDSS, namely, the spectrum including galactic extinction. Night sky emission linesThe night sky emission lines at 5577Å, (when there is auroral activity) at 6300Å, 6363Å, and in the OH forest in the red can be very strong, and leave significant residuals in the spectra whose amplitude is occasionally underestimated by the noise model. Be cautious about interpreting the reality of weak features close to these lines. Plates with not-quite-perfect spectrophotometryA small number of plates, given in the list of not-quite-perfect plates, suffered from a variety of minor problems. The CCD frames for several plates suffered from a transient electronic problem in the red camera in Spectrograph 2, causing the columns of the CCD to be misaligned on readout. This was fixed in software, and we believe the data to be reliable. Another set of plates labeled "Spectrograph Collimation Problem" suffered from having the spectrograph collimator improperly focused. This problem caused a mismatch between the flatfields and the science exposure instrumental profile shapes on the CCD in both the spatial and wavelength directions, causing the optimal extraction process to reject an excessive number of pixels. This problem was fixed in software, and comparing overlapping objects from adjacent plates confirms that the redshifts from these problematic plates are unbiased. However, the spectra themselves should not be used for precision work or spectrophotometry. Other plates have individual problems as noted. E.g., during the exposure of one plate, light from an LED somewhere on the telescope found its way to the spectrographs, resulting in an artificial excess of light centered roughly at 6500Å; the spectrophotometry of this plate is quite poor. Mismatches between spectra and photometric dataIn a few cases, the fiber mapping failed which identifies which
fiber has been plugged into which hole. When this happens for two or
more objects on the sample plate, there is the possibility of wrong
matches between spectra and photometric objects. There are 123 objects
for which the mapping between object and spectrum cannot be
established ("unmapped fibers"); their ra/dec is listed as
-9999 in the spectroscopic data set but synthetic fiber magnitudes
( Errors in the deblending algorithm in the The special plates have special issues regarding photometric matches. Some of the special plates were targeted using photometry that is not part of DR7, or not even SDSS photometry. Therefore, the SDSS photometry for objects on plates 797, 1468, 1471, 1472, 1665, and 1666 is only available through DRsup. In addition, special plates with SDSS photometry are different from
regular SDSS plates in that they have no tiling information associated
with them. Therefore, the To obtain photometric information for non-SEGUE special-plate spectra, perform the following join: select columns from specObjAll as so inner join photoObj as po on so.bestobjid = po.objid Galaxy velocity dispersion measurementsThe velocity dispersion measurements distributed with SDSS spectra use template spectra convolved to a maximum sigma of 420 km/s. Therefore, velocity dispersion sigma > 420 km/s are not reliable and must not be used. The figure below shows the quality of velocity dispersion error estimates.
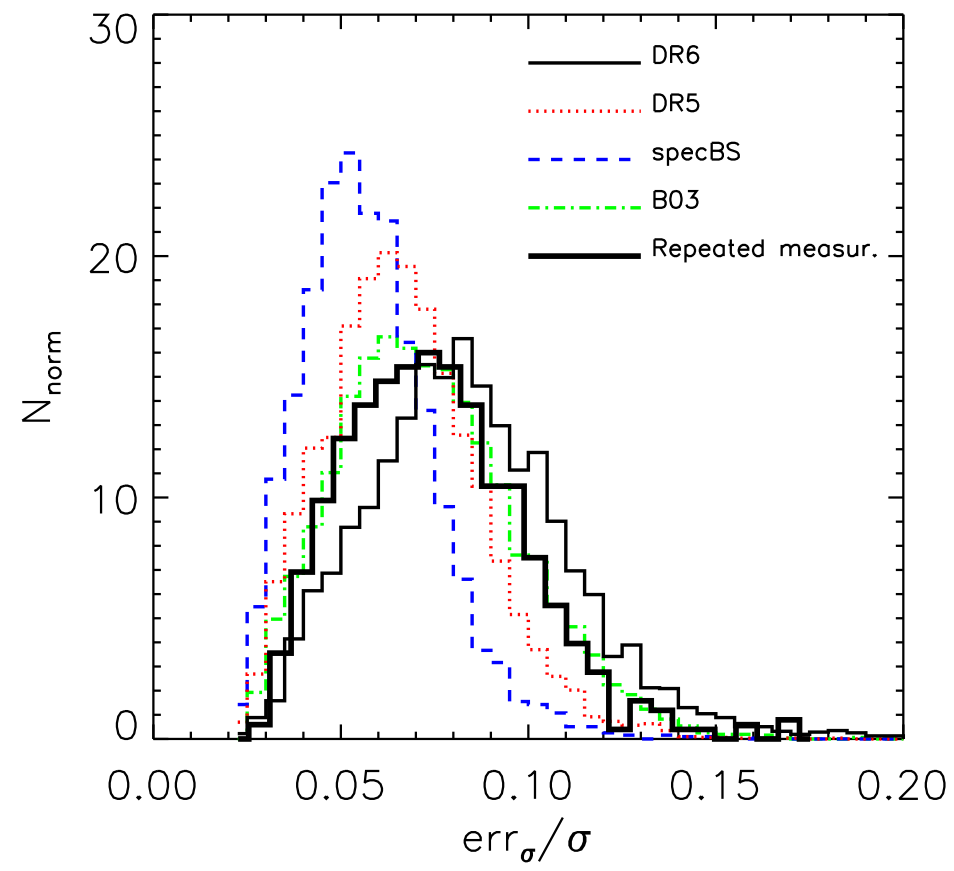 Error distribution of the velocity dispersion measurements from spectro1d DR6 (thin black solid line), spectro1d DR5 (dotted red line), specBS (dashed blue line), and B03 (dotted-dashed green line). The thick solid line was obtained by comparing repeated measurements. We recommend the user to not use SDSS velocity dispersion measurements for:
Also note that the velocity dispersion measurements are not corrected to a standard relative circular aperture. See the velocity dispersion algorithm for details. "Bonus" plates beyond the survey limitsA few plates target objects beyond the survey limits for a particular survey stripe, stripe 10 (see survey coverage page). These plate/MJD combinations are:
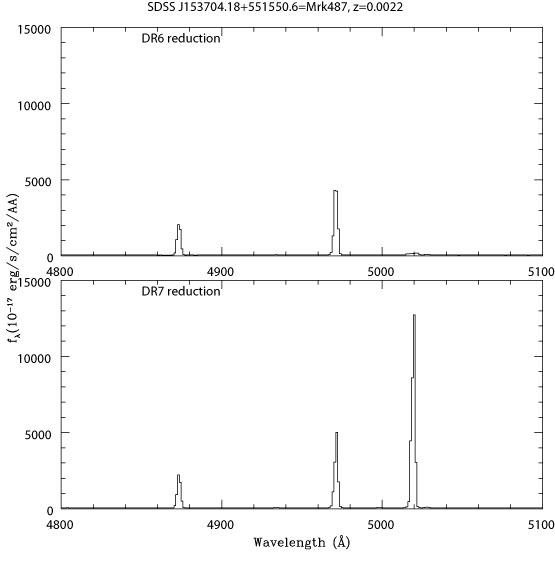
Their corresponding These objects have been declared Accuracy of stellar radial velocitiesThe accuracy of stellar radial velocities in DR2/DR3 and beyond is described on a separate page. Clipped Spectral LinesThe spectroscopic pipeline combines observations of a given object on the red and blue spectrographs, and between the separate 15-minute exposures on the sky, by fitting a tightly-constrained spline to the data, allowing discrepant points such as cosmic rays to be rejected. This spline requires as input the effective resolution of the spectra. As described in the DR6 paper,
it did not do a perfect job; occasionally, very strong and sharp emission lines were erroneously
rejected by this algorithm. This turned out to be due to the fact that the spline code did not
adequately track the changing resolution of the spectra as a function of wavelength and fiber
number. Including this effect much improved the behavior of this algorithm. The figure below shows
an example spectrum of an object affected by this problem in DR6, and its improved counterpart
in DR7, as is apparent by the correct 3:1 ratio of the 5007 and 4959 Å lines of [OIII].
The total number of objects that were affected by this problem is quite small; affecting less
than 1 percent of galaxies with Hβ equivalent width >25 Å.
There is another problem, unfortunately not fixed in DR7, which has a similar effect. If the line is so bright that it is saturated in the individual 15-minute exposures of the spectrograph, it will also appear clipped. Unfortunately, such saturated pixels are not flagged as such, although usually such lines are recognizeable as having an inverse variance equal to zero. Luckily, objects with such strong emission lines are very rare, but the user should be aware of the possibility of objects with extremely strong emission lines and unphysical or unusual line ratios. Last modified: Fri Oct 31 17:31:24 CET 2008 |