| Home |
| Where to Start |
| News and Updates |
| Tutorials |
| Data Products |
| Data Access |
| Sky Coverage |
| Instruments |
| Data Flow |
| Algorithms |
| Glossary |
| Help and Feedback |
| Known Problems |
| Search |
 |
The Quality of the SpectrophotometryObtaining accurate spectrophotometry for fiber spectra is a challenging task due to the small size of the fibers relative to the science targets. The SDSS employs some unique techniques which are described on the algorithms page. There have been substantial improvements to the algorithms which photometrically calibrate the spectra published in DR2 and beyond which are also described in detail on that page. We have quantified the improvements in the spectrophotometry from
DR1 to DR2 and beyond in two ways. The net effect of these changes to the
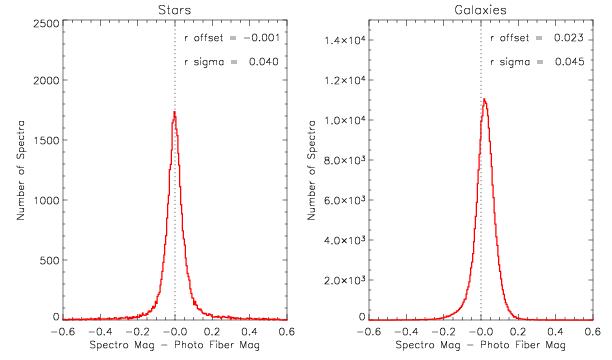
 Comparison of synthetic
r magnitudes from the spectra with  Comparison of synthetic
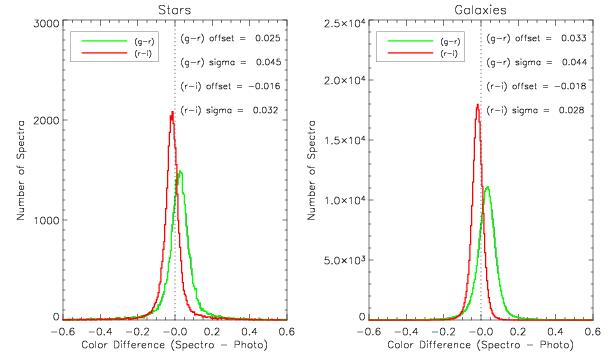
g-r, r-i colors synthesized from the spectra with
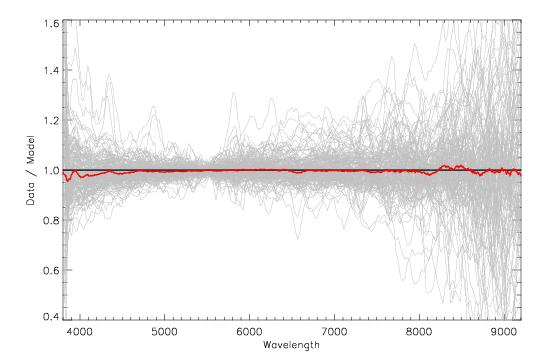
The first of the two figures above compares r fiber magnitudes with those synthesized from the spectra of all DR2/DR3 objects with spectral S/N per pixel greater than 5. For point sources alone, this rms difference is 0.040 magnitudes, a 45% improvement over DR1. For extended sources, the effect of the smears was to give a systematic offset between spectroscopic and fiber magnitudes of up to a magnitude; with the reductions used in DR2 and beyond, this trend is gone. The slight offset of the mean from zero is a seeing effect. We cannot make this comparison for extended sources in DR1 because their fluxes are calibrated to match the total light in the smear aperture which can be greater than that in the fiber aperture by as much as a magnitude. The lower of the two figures above compares the g-r and r-i colors derived from the spectra and photometry; the scatter is ~40% lower in DR2 and beyond than in DR1. The few percent offset of the colors from zero is an indication that there are small residual errors in our spectrophotometry, perhaps due to errors in the theoretical models used to calibrate the standard stars, or to offsets between our photometric system and a true AB system. To evaluate our spectrophotometry over smaller scales, of order 100Å, we compared the calibrated spectra of a sample of 166 hot DA white dwarfs drawn from the DR1 White Dwarf Catalog (Kleinman et al. 2004) to theoretical models. DA white dwarfs are useful for this comparison because they have simple hydrogen atmospheres that can be accurately modeled (e.g., Finley, Koester, & Basri 1997). The figure below shows the results of dividing each spectrum by its best fit model. The median of the curves shows a net residual of order 2% at the bluest wavelengths. This is a major improvement over DR1 where the residuals were of order 15% at 4300Å due to the mismatch between the observed standard stars and the assumed model. 
Comparison of white dwarf spectra and models. The grey lines represent 166 individual spectra divided by their best fit model. The heavy red line is the median. The equivalent median residuals in DR1 were of order 15% at 4300Å; they are now of order a few percent. Last modified: Tue Jul 26 21:57:00 CDT 2005 |