New Reductions of SEGUE Imaging Data and Crowded FieldsPSPhot PhotometryAs was noted in the DR6 paper, the SDSS imaging pipeline (photo) was designed to analyze data at high Galactic latitudes, and is not optimized to handle very crowded fields. The Legacy survey is restricted to high latitudes, and photo performs adequately throughout the Legacy footprint. However, at lower latitudes, when the density of stars brighter than r=21 grows above 5000 deg-2, the pipeline is known to fail, as it is unable to find sufficiently isolated stars to measure an accurate PSF, and the deblender does poorly with overly crowded images. Many of the SEGUE scans probe these low latitudes, and we therefore adapted an alternative stellar photometry code called PSPhot developed by the Pan-STARRS team (Kaiser et al. 2002; Magnier 2006) to be used for these runs. In brief, we first run this code, and then run photo using the list of objects detected by PSPhot as input to help photo's object finder in crowded regions. This approach thus provides two sets of photometry at low latitudes. Like e.g., DAOPHOT ( Stetson 1987), PSPhot begins with the assumption that every object is unresolved, and therefore does a better job than photo in crowded stellar regions. It uses an analytical model based on Gaussians to describe the basic PSF shape, with parameters which may vary across the field of the image to follow the PSF variations. It also uses a pixel-based representation of the residuals between the PSF objects and the analytical model, which is also allowed to vary across each field. Candidate PSF stars are selected from the collection of bright objects in the frame by searching for a tight clump in the distribution of second moments. After rejecting outliers, the PSF fit parameters are used to constrain the spatial variations in the PSF model. Unlike photo, PSPhot processes each frame separately (without any requirement of continuity of PSF estimation across frame boundaries), and each filter separately (without any requirement that the list of objects between the separate filters agree). The pipeline outputs positions and PSF magnitudes (and errors) for each detected object; the results are found in the PsObjAll table in the CAS. The resulting photometry is then matched between filters using a 1" matching radius. While the estimated PSF errors output by photo include a term from the uncertainty in the PSF fitting, this component is not included in the errors reported by PSPhot. We then run photo, asking it to carry out photometry at the position of each object detected by PSPhot, in addition to the positions of objects photo itself detects. This allows photo to do a much better job of distinguishing individual objects in crowded regions. In addition, the pipeline is fine-tuned to less aggressively look for overlap between adjacent objects, and not to give up as soon as it does at high latitude when faced with deblending large numbers of objects. We describe below how the photometry directly out of PSPhot, and that from photo, compare. The SDSS PSF photometry had an offset applied to it to make it agree with aperture photometry of bright stars within a radius of 7.43''; this large aperture photometry was in fact what was used by ubercalibration to tie all the photometry together (Padmanabhan et al. 2008). In crowded regions, finding sufficiently isolated stars to measure aperture photometry becomes difficult. PSPhot photometry was forced to agree with these large-aperture magnitudes for bright stars; this was done in practice by determining, for each CCD in the imaging camera for each run, the average aperture correction needed to put the two on the same system, using stars at Galactic latitude |b| > 15º, where crowding effects are less severe. If any part of a SEGUE imaging run extended to |b| < 25º, the entire run was processed through the photo and PSPhot code. This sample includes most (but not all) of the SEGUE imaging runs. These PSPhot+photo processed runs, designated with rerun=648 in the DR7 CAS and DAS, are declared the Best reduction of these SEGUE runs. There is also an inferior Target version of these SEGUE runs which was used to design SEGUE spectroscopic plates; it is based on photo alone, as the PSPhot code was unavailable at the time the plates were designed. The Target reductions have rerun=40, and are segregated to the SEGUETARGDR7 database. This processing revealed a problem with photo. In crowded regions, one cannot find sufficiently isolated stars to measure counts through such a large aperture, and in practice, the code corrected PSF magnitudes to an aperture photometry radius of 3.00” instead, whenever any part of a given run dipped below |b| = 8º. Thus the aperture correction was underestimated, typically by 0.03--0.06 mag, depending on the seeing. This was not a problem for any of the Legacy imaging scans, but is very much an issue for the SEGUE runs. Fortunately, there is a strong correlation, in a given detector, between the aperture correction from a 3.00” aperture to a 7.43” aperture (as measured on high-latitude fields), and the seeing. We therefore applied this correction after the fact to the photo PSF, de Vaucouleurs, exponential, and model magnitudes for all SEGUE runs affected by this problem. This was carried out before ubercalibration, so these runs are photometrically calibrated in a consistent way. Comparison of photo and PSPhot PhotometryThe quality of the photometry produced by PSPhot, and by photo with the PSPhot-detected objects as input, was evaluated by comparing the magnitudes computed by the two methods. Within each field, we calculated the median of the difference of PSF magnitudes for stars with 14 < u,g,r,i,z < 20. This median difference had an rms of 0.014 mag. Fields with a difference greater than 0.08 mag are suspect, and further investigation is needed to determine which of the two pipelines might be at fault. We followed McGehee et al. (2005) to measure reddening-free colors of the same stars that track the stellar locus: Qriz = (r - i) - Eriz(i - z), Reddening-free colors Median Qgri and Qriz colors in each field were computed for objects identified as stars in each field, and satisfying magnitude and color cuts as follows: 14<(u,g,r,i,z)<20, 0.5<(u-g)<1.9, 0.0<(g-r)<1.2, -0.2<(r-i)<0.8, and -0.2<(i-z)<0.6. The Q-parameters were found to be lower by up to 0.1 mag at low Galactic latitudes; to remove this effect, we fit a model of a constant plus Lorentzian to the median Q values as a function of Galactic latitude, and subtracted it. The distributions of the Qgri and Qriz values for both photo and PSPhot are compared as density plots here:
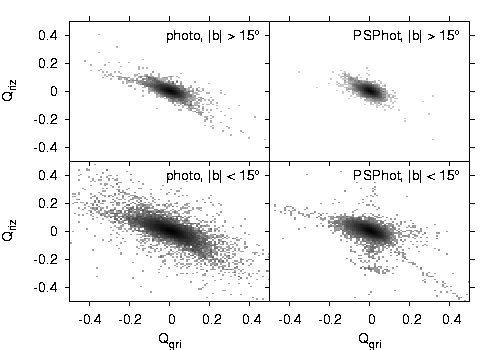
 The distribution of median Qgri and Qriz parameters measuring the position of the stellar locus within each field for the photo (left) and PSPhot (right) photometric pipelines; zero values are indicative of uniform photometry. Within the Galactic plane (lower panels), the PSPhot values are more concentrated, but contain a higher number of systematic departures from the main locus. The PSPhot code in fact gives a tighter locus at high latitudes as well (upper panels). Histogram equalization of the gray-scale was used to emphasize low density regions. From the reddenining free color equations, photometric errors in a single filter manifest themselves differently: δ g as a shift in Qgri, δ r as a line with slope dQriz/dQgri = -1/(1+Egri) = -0.35, δ i as a line with slope dQriz/dQgri = -(1+Eriz)/Egri = -1.07, and δ z as a shift in Qriz. The photo data in a given field was flagged as bad when either |Qgri| or |Qriz| > 0.12 mag (≥5σ) as measured from photo magnitudes, and similarly for the PSPhot outputs. Of course, a field could be flagged as bad in both sets of outputs. By this criterion, about 2% of the fields processed with PSPhot were flagged bad based on the photo outputs, and 3.6% were bad based on PSPhot photometry. The vast majority of the flagged fields are within 15º of the Galactic plane, and essentially all the fields in which the median difference between photo and PSPhot photometry was greater than 0.08 mag in a given band were flagged as bad by the Q criteria. This flag and the Qgri and Qriz quantities themselves can be found in the fieldQA table in the CAS. Although more fields are flagged based on the PSPhot outputs, the PSPhot scatter in the ditribution plots is tighter at both high and low Galactic latitudes than for photo. The PSPhot stellar photometry is therefore preferred for studies of the stellar locus (we have not fully assessed its robustness to outliers), but comes with the caveat that fields flagged bad should be identified in the fieldQA table and be culled. An alternative check of SDSS photometry in dense stellar fields was carried out by An et al. (2008), who reduced the SDSS imaging data for crowded open and globular cluster fields using the DAOPHOT/ALLFRAME suite of programs ( Stetson 1987, 1994). At a stellar density of ∼400 stars deg-2 with r<20, they found ∼2% rms variations in the difference between photo and DAOPHOT magnitudes in the scanning direction in all five bandpasses (see their Figure 3). The systematic structures are likely due to imperfect modeling of the PSFs in photo, given that DAOPHOT magnitudes exhibit no such large variations with respect to aperture photometry. In other words, the PSF variations were too rapid for the photo pipeline to follow over a time scale covered approximately by one field (≈10' or ≈54 seconds in time). An et al. (2008) further examined the accuracy of photo magnitudes in semi-crowded fields using three open clusters in their sample. Stellar densities in these fields were as much as ∼10 times higher than those in the high Galactic latitude fields, but photo recovered ∼80-90% of stellar objects in the DAOPHOT/ALLFRAME catalog. An et al. (2008) found that these fields have only marginally stronger spatial variations in photo magnitudes than those at lower stellar densities. *Text and figures on this page come from an author-created, un-copyedited version of the SDSS Data Release 7 paper, an article submitted to Astrophysical Journal Supplements. IOP Publishing Ltd is not responsible for any errors or omissions in this version of the manuscript or any version derived from it. A preprint of the DR7 paper is available from the arXiv preprint server. Last modified: Tue Apr 15 12:00:12 CDT 2003 |
